FRG, partnered with Preqin, has developed a system for simulating cash flows for private capital investments (PCF). PCF allows the analyst to change assumptions about future economic scenarios and investigate the changes in the output cash flows. This post will pick a Venture fund, shock the economy for a mild recession in the following quarters, and view the change in cash flow projections.
FRG develops scenarios for our clients. Our most often used scenarios are the “Growth” or “Base” scenario, and the “Recession” scenario. Both scenarios are based on the Federal Reserve’s CCAR scenarios “Base” and “Adverse”, published yearly and used for banking stress tests.
The “Growth” scenario (using the FED “Base” scenario) assumes economic growth more or less in line with recent experience.
The “Recession” scenario (FED “Adverse”) contains a mild recession starting late 2019, bottoming in Q2 2020. GDP recovers back to its starting value in Q2 2021. The recovery back to trend line (potential) GDP goes through Q2 2023.

The economic drawdown is mild, the economy only loses 1.4% from the high.
[table id=5 /]
Equity market returns are a strong driver of performance in private capital. The total equity market returns in the scenarios include a 34% drawdown in the index. The market fully bottoms in Q1 2022, and has recovered to new highs by Q1 2023.

This draw down is shallow compared to previous history and the recovery period shorter:
[table id=6 /]
The .COM and Global Financial Crisis (GFC) recessions took off nearly 50% of the market value. This recession only draws down 34%. The time from the peak to the trough is 10 and 6 quarters for the .COM and GCF respectively. Here we are inline with the .COM crash with a 10-quarter peak to trough period. This recovery is faster by nearly double than either of the recent large drawdowns at 8 quarters versus 17 and 16.
We start by picking a 2016 vintage venture capital fund. This fund has called around 89% of its committed capital, has an RVPI of 0.85 and currently sports about an 18% IRR. For this exercise, we assume a $10,000,000 commitment.
Feeding the two scenarios, this fund, and a few other estimates into the PCF engine, we can see a dramatic shift in expected J-curve.
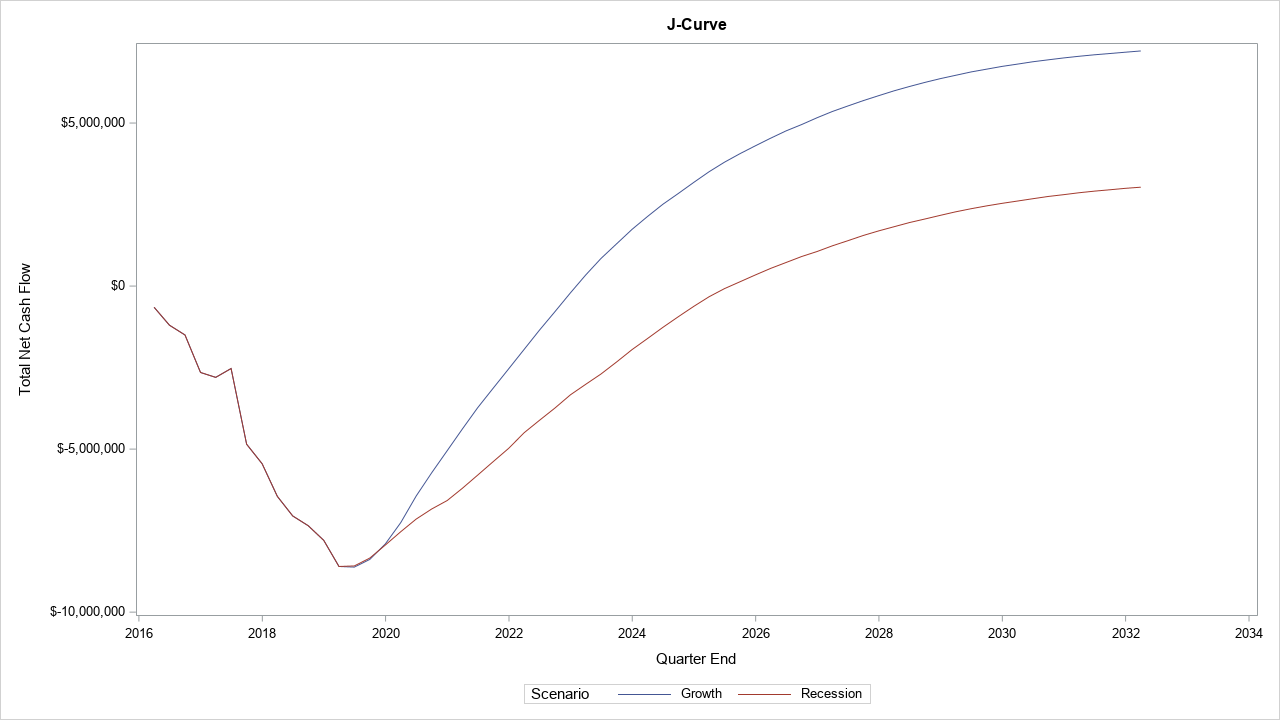
Under the “Growth” scenario, the fund’s payback date (date where total cash flow is positive) is Q1 2023. The recession prolongs the payback period, with the expected payback date being Q3 2025, an additional 2.5 years. Further, the total cash returned to investors is much lower.
This lower cash returned as well as the lengthening of the payback period have a dramatic effect on the fund IRR.

That small recession drops the expected IRR of the fund a full 7% annualized. The distribution shown in the box and whisker plot above illustrates the dramatic shift in possible outcomes. Whereas before, there were only a few scenarios where the fund returned a negative IRR, in the recession nearly a quarter of all scenarios produced a negative return. There are more than a few cases where the fund’s IRR is well below -10% annually!
This type of analysis should provide investors in private capital food for thought. How well do your return expectations hold up during an economic slowdown? What does the distribution of expected cash flows and returns tell you about the risk in your portfolio?
At FRG, we specialize in helping people answer these questions. If you would like to learn more, please visit www.frgrisk.com/vor-pcf or contact us.
Dominic Pazzula is a Director with FRG, specializing in asset allocation and risk management. He has more than 15 years of experience evaluating risk at a portfolio level and managing asset allocation funds. He is responsible for product design of FRG’s asset allocation software offerings and consults with clients helping to apply the latest technologies to solve their risk, reporting, and allocation challenges.